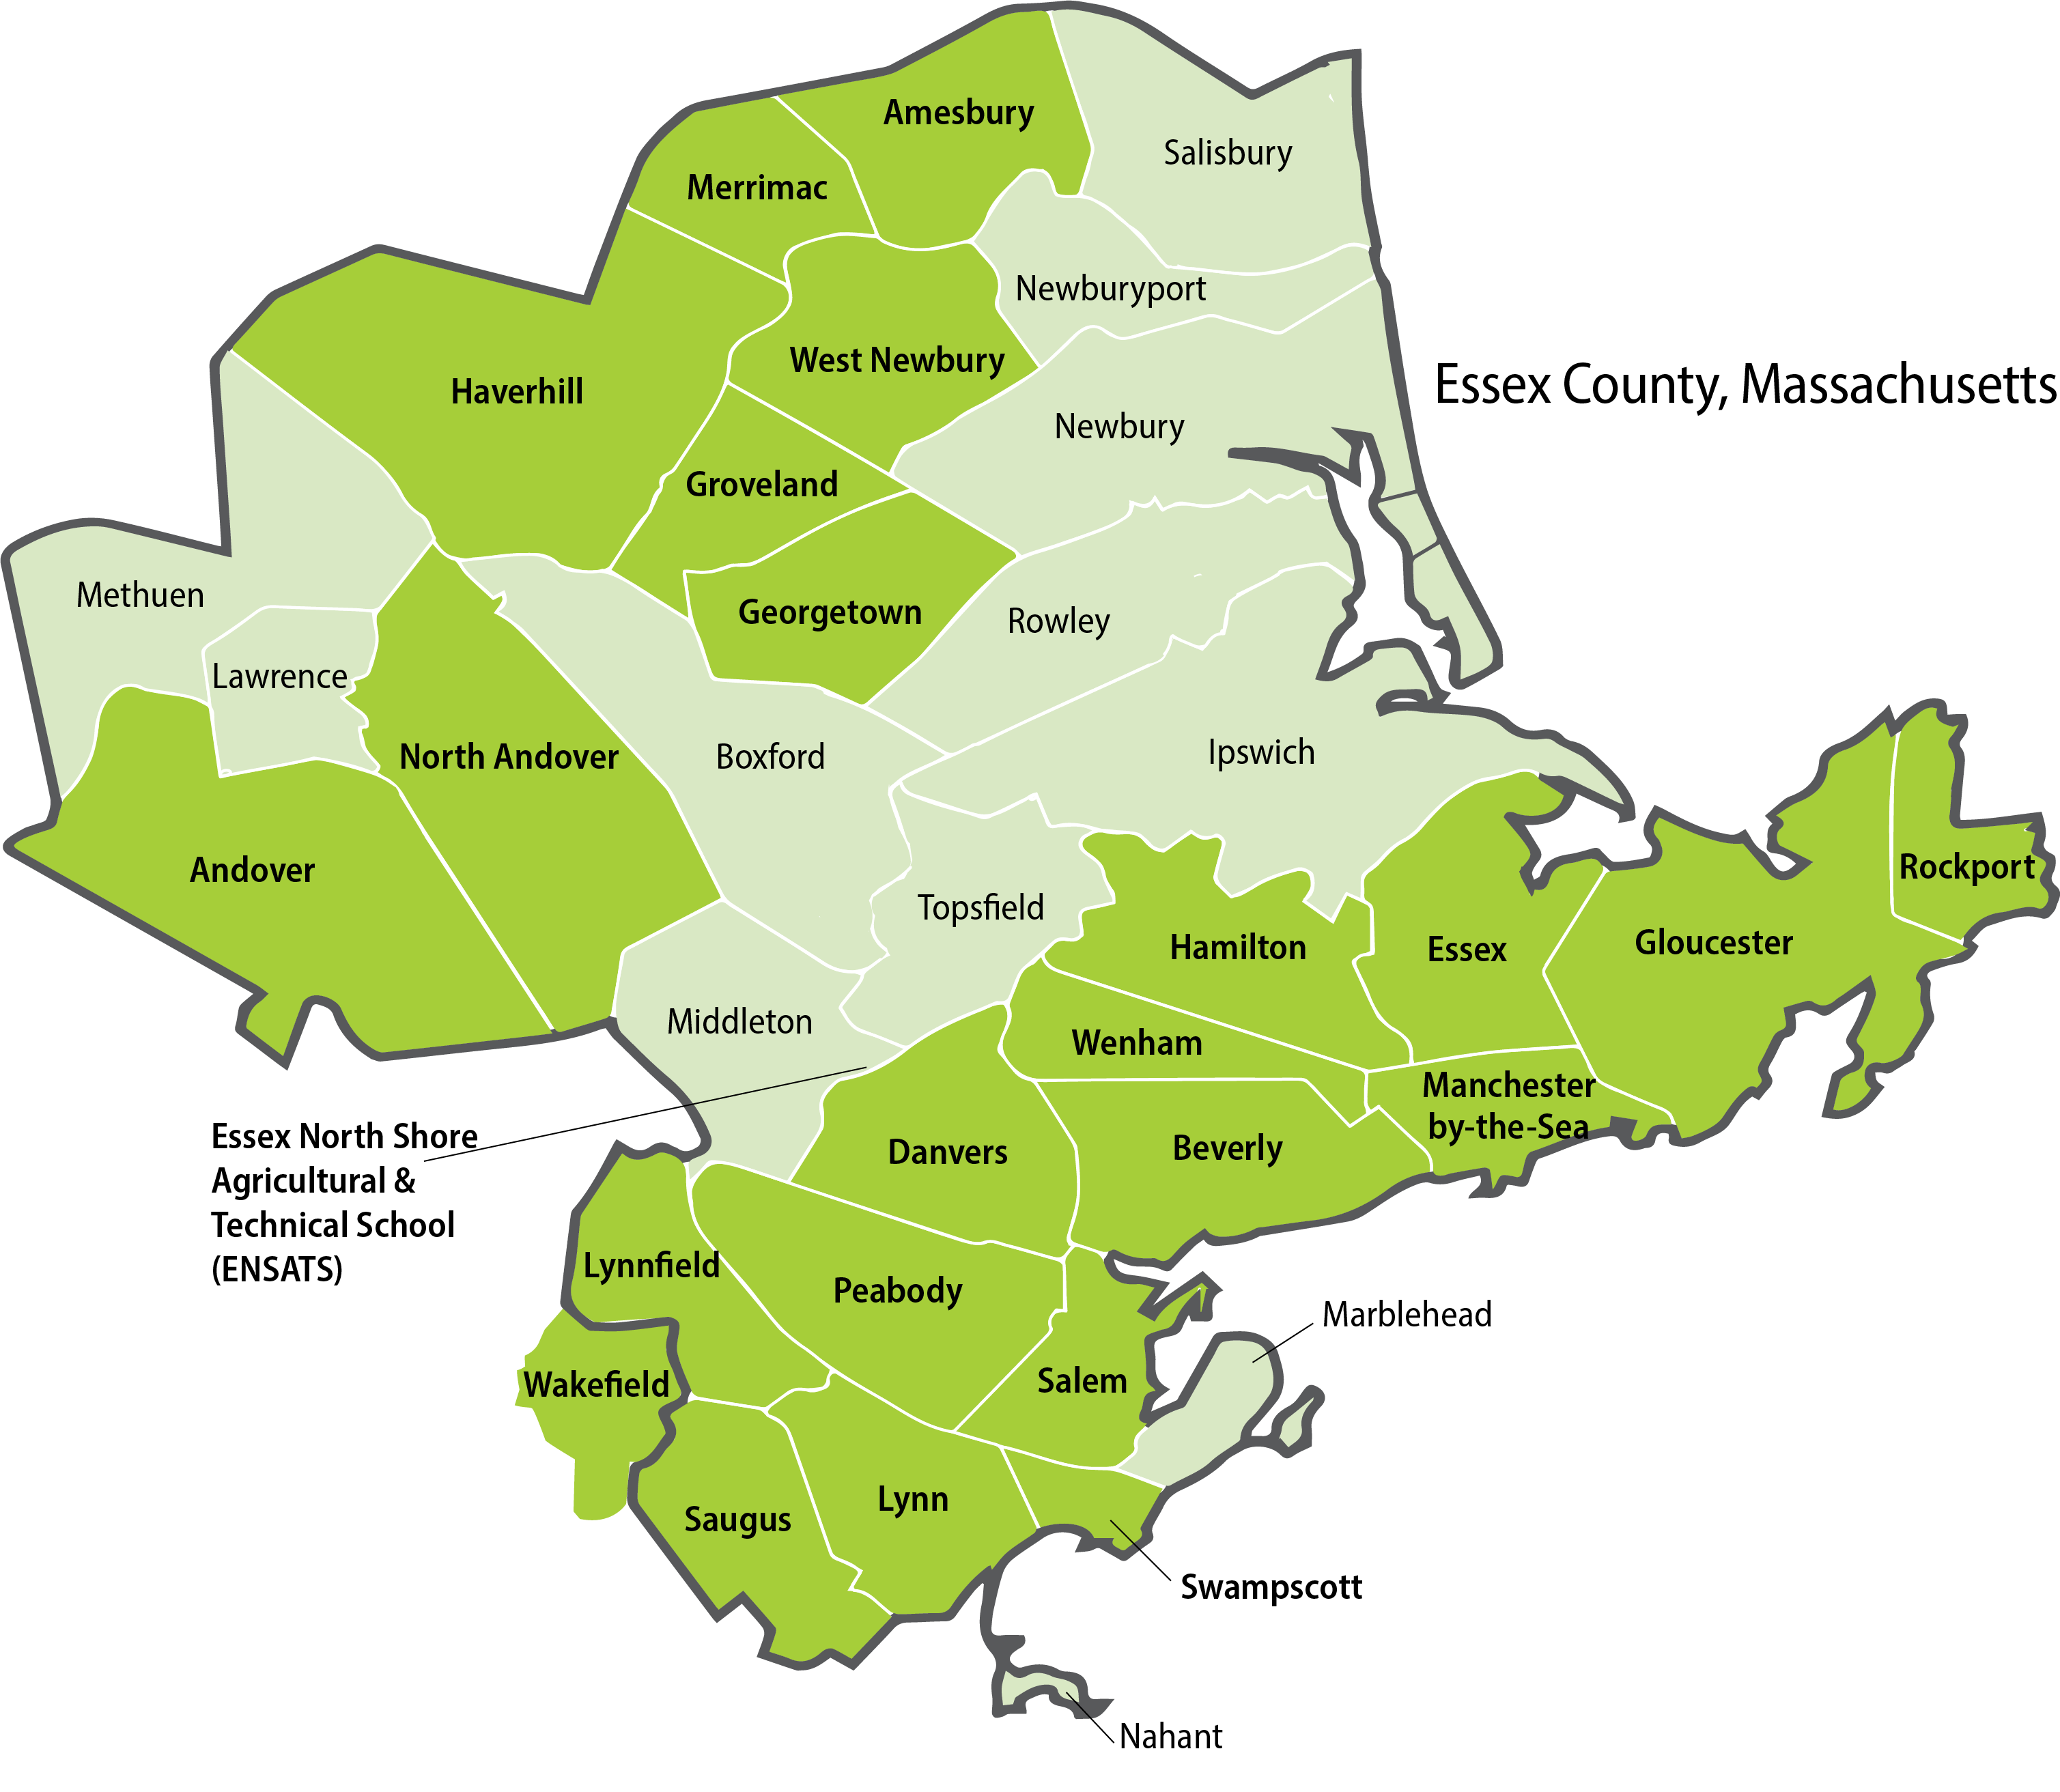
Just north of Boston, Essex County has a total area of 828 square miles, with a population of approximately 810,000—making it the third-most populous county in Massachusetts. In many ways, it is a microcosm of the state—with expansive suburban communities, bustling urban centers, and acres of rural horse country. Natural resources abound, including wildlife preserves, a national park, and a vibrant waterfront. The county is also known for its historical and cultural riches, including 11 institutions of higher education, a world-class museum, and many sites of historical significance.
Essex County is also home to about 24 urban, suburban, and rural school districts. When we first got acquainted with the county, we developed relationships with two of the largest school districts, developing and implementing a strategy with each based on their expressed needs.
Due to significant demographic and socioeconomic shifts over the past decade, school districts in these cities and towns were beginning to recognize the critical need for a different kind of professional learning than is typically offered. But their tight budgets precluded the depth and breadth of professional learning necessary—and for the most part, philanthropy only funded districts in the state’s urban centers like Boston and Worcester. We identified a need and sought to address it.
We asked: Why not bring together multiple districts for professional learning? The economies of scale would be meaningful. Even more important, educators—including superintendents, administrators, school leaders, support staff, and teachers—could benefit from having access to the collective wisdom of their colleagues across the county, people in their own backyards to whom they could turn for support.
Today, ECLC is an ongoing and vibrant network of educators challenging bias and disrupting inequitable systems to drive sustainable change in public schools. ECLC's participating school districts serve increasingly diverse student populations from prekindergarten (PK) through 12th grade.
| % Student Race/Ethnicity | % Student Populations | % FTE Teachers | ||||||||||
| African American | Asian | Hispanic | White | ELL | Low Income | Students w/ Disabilities | African American | Asian | Hispanic | White | total # FTE | |
| Amesbury | 1.7 | 1 | 11.4 | 81.5 | 2.7 | 33.8 | 23.7 | 0 | 0 | 1.4 | 98.6 | 139.5 |
| Andover | 2.5 | 18.6 | 9.2 | 64.9 | 3.4 | 11.5 | 19.2 | 0.3 | 1.7 | 4.6 | 92.5 | 349 |
| Beverly | 3.5 | 2.2 | 15.7 | 74.2 | 4.3 | 32.7 | 20.7 | 0.5 | 0.7 | 1 | 97.7 | 298 |
| Danvers | 2.8 | 2.4 | 11.4 | 81 | 2.5 | 25.1 | 19.9 | 0.44 | 0.44 | 1.5 | 97.1 | 227 |
| Essex North Shore Agricultural & Technical School | 2.1 | 1.8 | 14.7 | 77.5 | 0.7 | 23.7 | 18.4 | 0 | 1 | 0.2 | 98.8 | 94.9 |
| Gloucester | 1.8 | 1.4 | 13.9 | 78.3 | 8.8 | 47.5 | 25.6 | 0.5 | 0.5 | 1.1 | 97.9 | 200.8 |
| Hamilton-Wenham | 0.5 | 4.4 | 5.4 | 86.8 | 3 | 8.3 | 19.8 | 0 | 3.1 | 0.9 | 93.8 | 114.6 |
| Haverhill | 5.7 | 1.7 | 44.6 | 45.2 | 11.4 | 60.9 | 23.7 | 1.2 | 0.6 | 4.6 | 93.3 | 481.6 |
| Lynn | 7.4 | 7 | 71.3 | 11.2 | 39.7 | 74.2 | 18.5 | 1.3 | 1.2 | 6.2 | 90.2 | 1003 |
| Lynnfield | 2.1 | 7.4 | 6.7 | 79.5 | 2 | 10.2 | 17.5 | 0 | 0 | 0 | 100 | 134.4 |
| Manchester-Essex | 0.8 | 0.9 | 2 | 95.4 | 0.4 | 14.1 | 18.5 | 0 | 0.9 | 0.9 | 97.4 | 116.2 |
| Rockport | 1.1 | 1.6 | 4 | 90 | 0.5 | 27.7 | 23.9 | 0 | 0 | 0 | 100 | 69.2 |
| Salem | 6.9 | 2.3 | 45.3 | 41.5 | 17.6 | 60.3 | 25.5 | 1.5 | 1.1 | 6.5 | 260 | 91 |
| Saugus | 5.8 | 6.3 | 29.6 | 53.9 | 9.8 | 46 | 14.8 | 0.7 | 0 | 1.7 | 97.1 | 138 |
| Swampscott | 4 | 3.2 | 13.7 | 75.8 | 5.5 | 20.7 | 21.4 | 0.4 | 0 | 2.1 | 97.5 | 143.2 |
| Wakefield | 2.9 | 4.2 | 9.1 | 80 | 3.1 | 17.1 | 18.2 | 0 | 0.5 | 1.1 | 98.4 | 204.3 |